Product
Real-time impact.
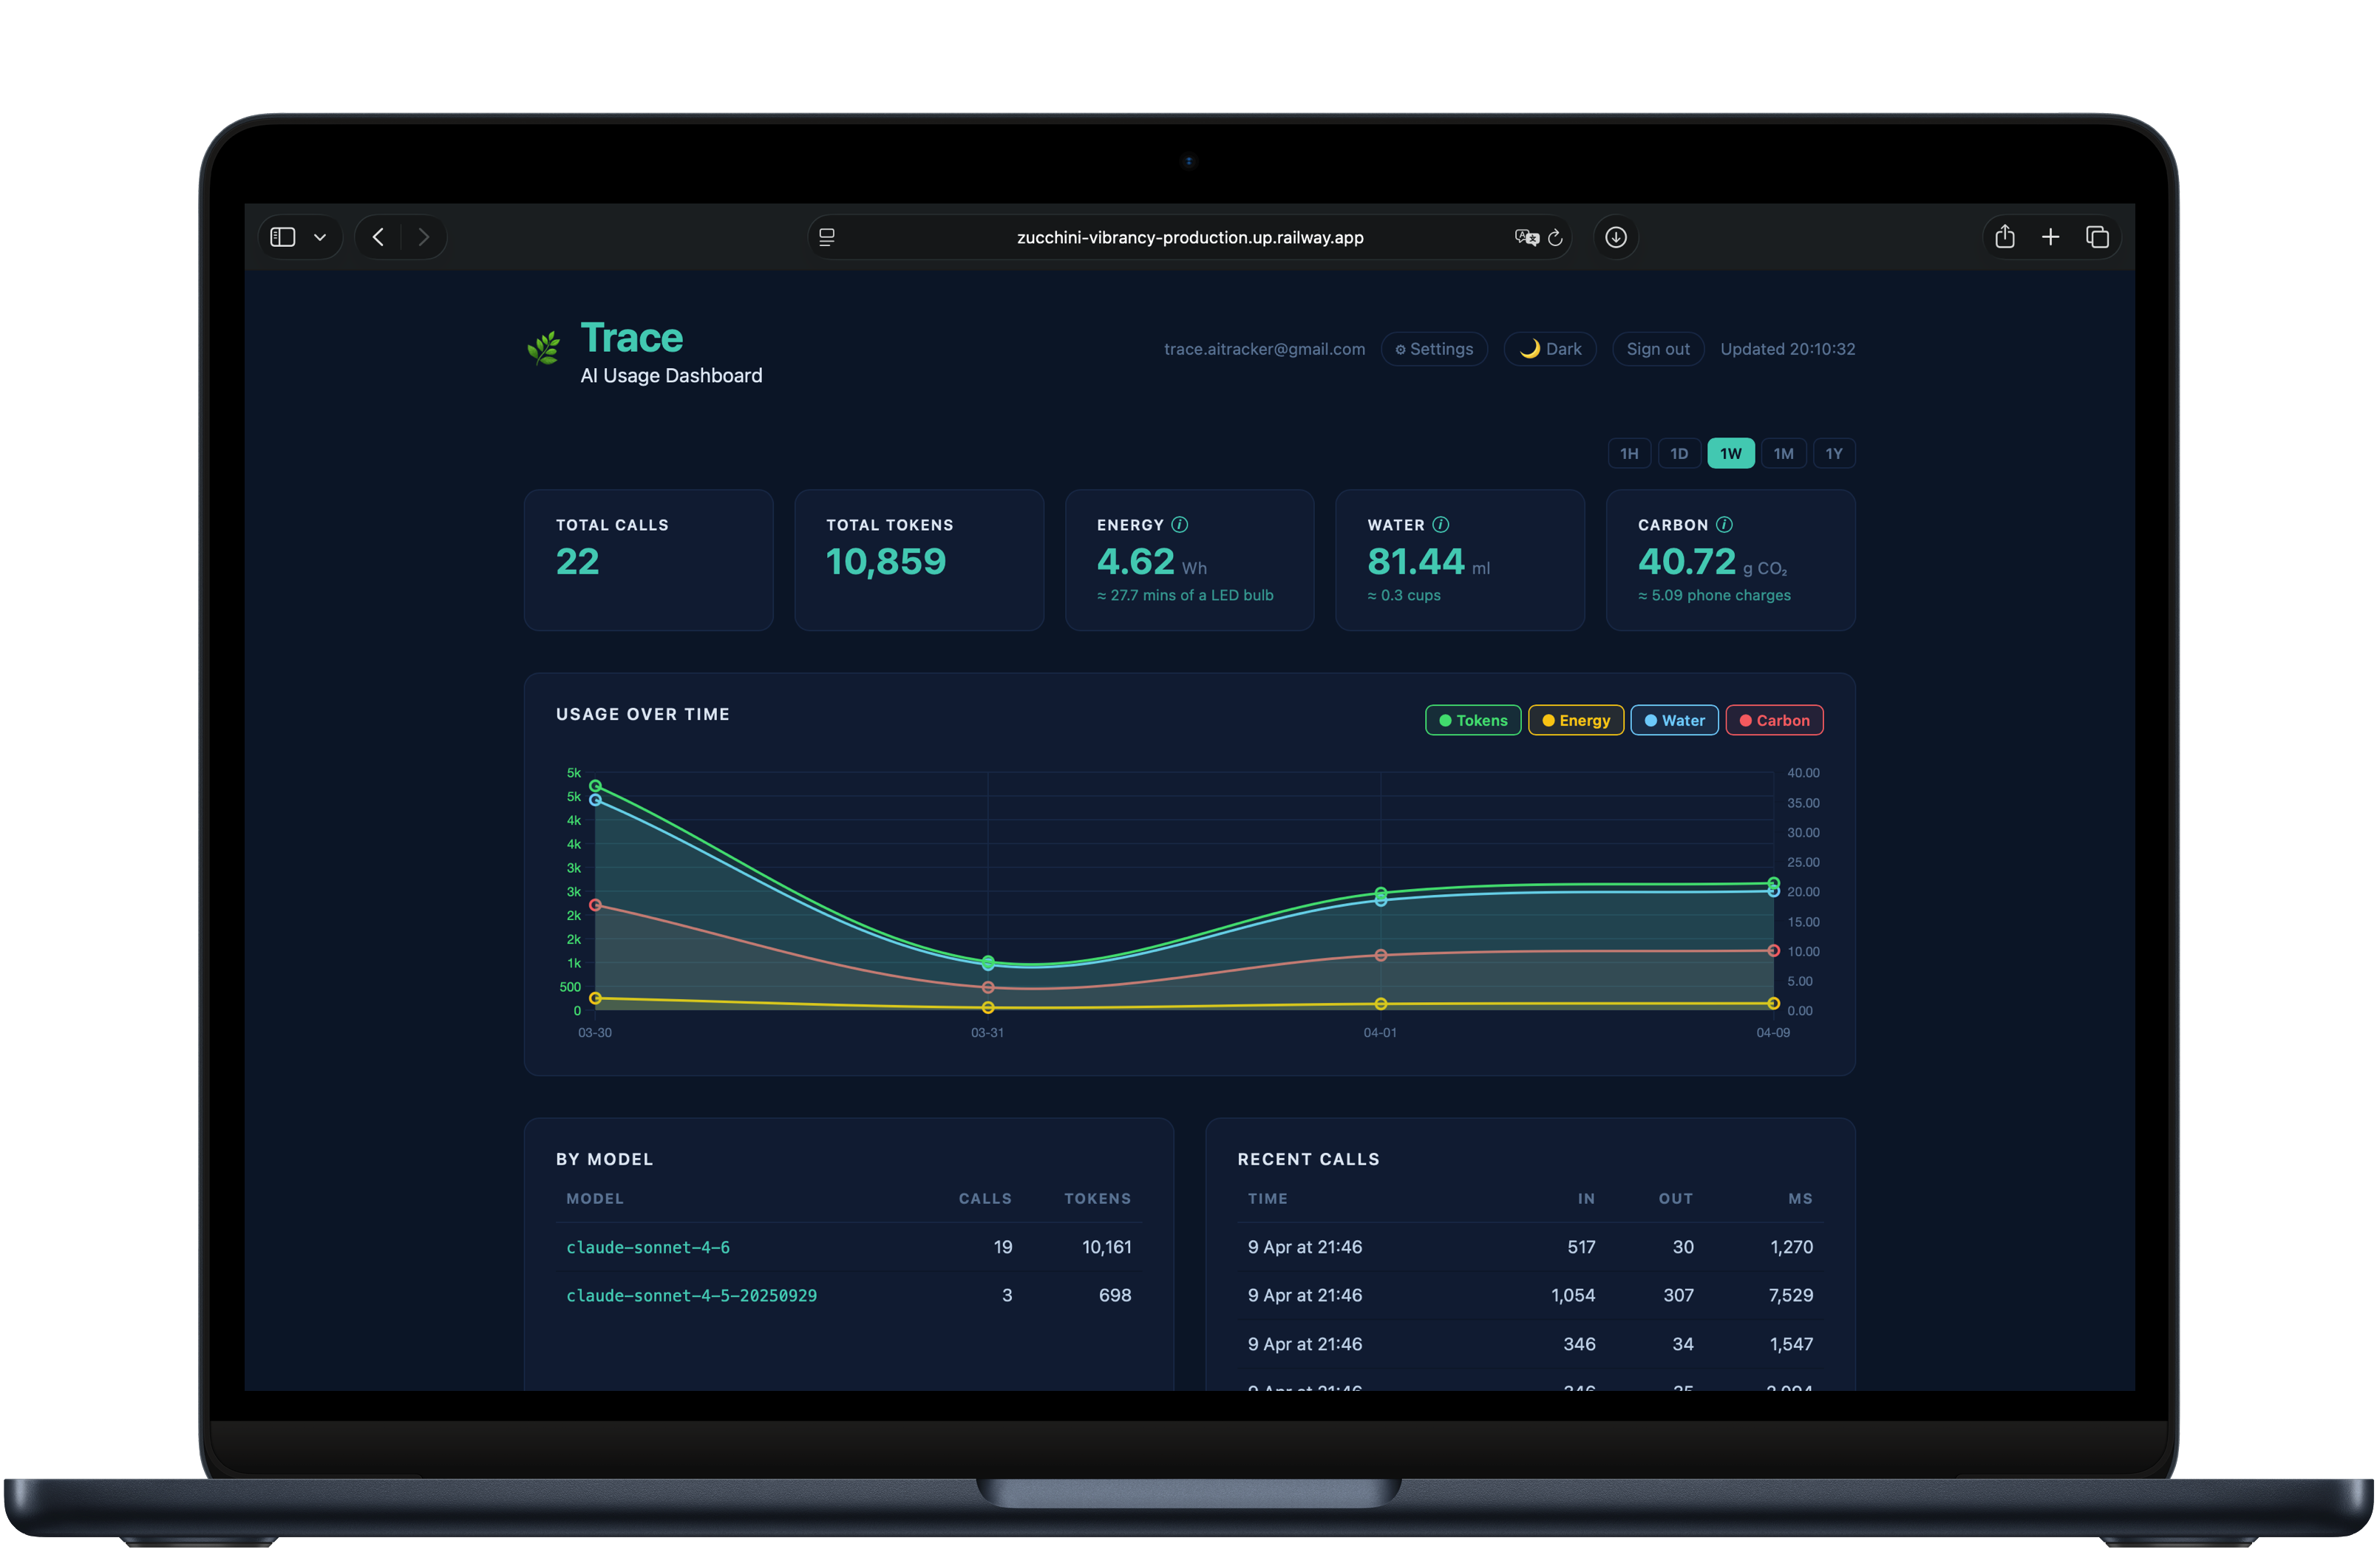
Per call.
A live dashboard showing energy (Wh), water (ml), and carbon (g CO₂) — broken down by model, over time.
Trace · AI Environmental Monitoring
Trace measures the energy, water, and carbon footprint of every AI API call — in real time, with zero code changes.
Problem
Developers track dollars and latency. Nobody tracks the environmental cost — not even the AI providers themselves.
Each inference call draws from power-hungry GPU clusters. No API today returns Wh consumed per request.
measured in Wh
Data center cooling consumes billions of litres of fresh water annually — hidden behind every prompt you send.
measured in ml
Scope 3 AI emissions are an emerging regulatory requirement. There is currently no baseline to measure against.
measured in g CO₂
Why now
Compliance, cost, and conscience
are converging on the same need.
945 TWh
AI data center energy use by 2030 — equivalent to all of Germany's electricity consumption
$246B
AI API market by 2030. Every dollar spent has an unmeasured environmental twin.
FY2027
EU CSRD deadline for AI emissions disclosure. No reporting tool exists yet.
How it works
Trace sits silently between your application and any AI provider, auditing every token's impact in real time.
01 / Your App
Sends request
Your existing code calls the Trace endpoint — identical to any OpenAI-compatible API.
02 / Trace
Measures cost
Exact token counts captured. Energy, water, and carbon calculated from peer-reviewed science.
03 / AI Provider
Responds
Your response arrives as normal. Zero added latency. Zero provider lock-in.
04 / Dashboard
Shows impact
Real-time per-model breakdown with exportable ESG reports, audit-ready.
Zero code changes required — drop-in replacement for any OpenAI-compatible endpoint.
Product
A live dashboard showing energy (Wh), water (ml), and carbon (g CO₂) — broken down by model, over time.
Methodology
Every metric is derived from published research and peer-reviewed science — not estimates or averages.
Energy
Per-token energy cost derived from published GPU TDP figures and academic benchmarks on inference energy consumption.
Water
Data center water usage effectiveness (WUE) ratios sourced from operator disclosures and IEA data center efficiency reports.
Carbon
CO₂ equivalent calculated using average US grid intensity and cross-referenced against EPA emissions factors for electricity.
Exact counts, not estimates
Trace reads exact input_tokens and output_tokens from every API response — no sampling, no approximation. Your numbers are always reproducible.
Get started
Trace is live and free to use. Point your AI client at the proxy and your dashboard populates immediately.
✓ You're on the list — we'll be in touch.